DevTools
Firefox DevTools are a set of web developer tools that can be used to examine, edit, and debug a website's HTML, CSS, and JavaScript. Servo has support for a subset of DevTools functionality, allowing for simple debugging.
Connecting to Servo
- Run servoshell with the DevTools server enabled.
The number after the
devtoolsparameter is the port used by the server.
./mach run --devtools=6080
-
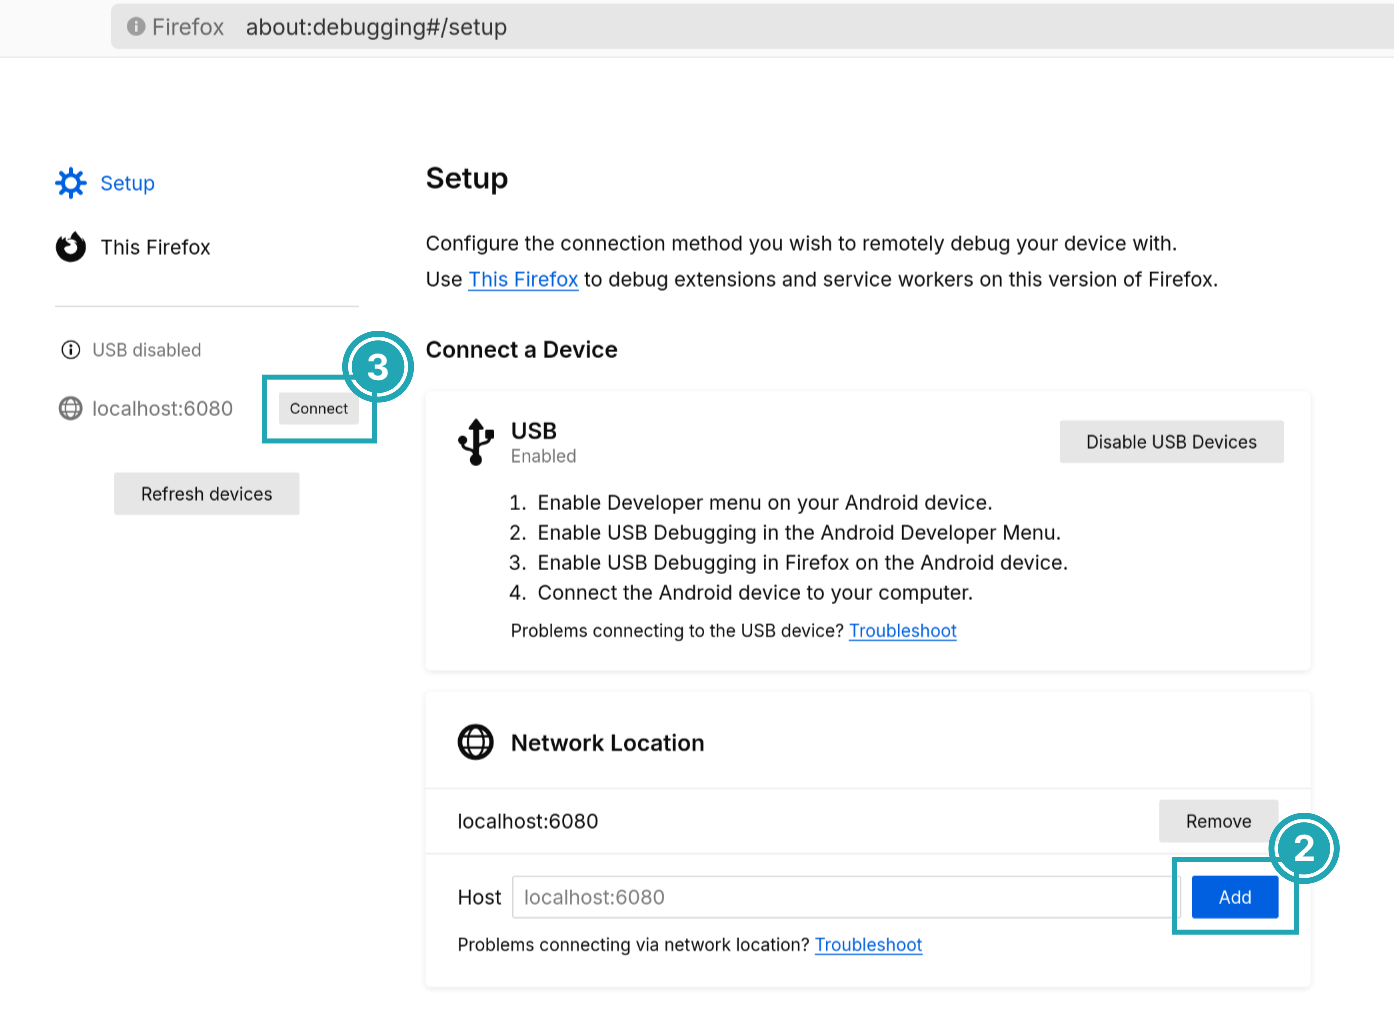
Open Firefox and go to
about:debugging. If this is your first time using the DevTools integration, go to Setup and addlocalhost:6080as a network location. The port number must be the same as in the previous step. -
Click on Connect in the sidebar next to
localhost:6080.
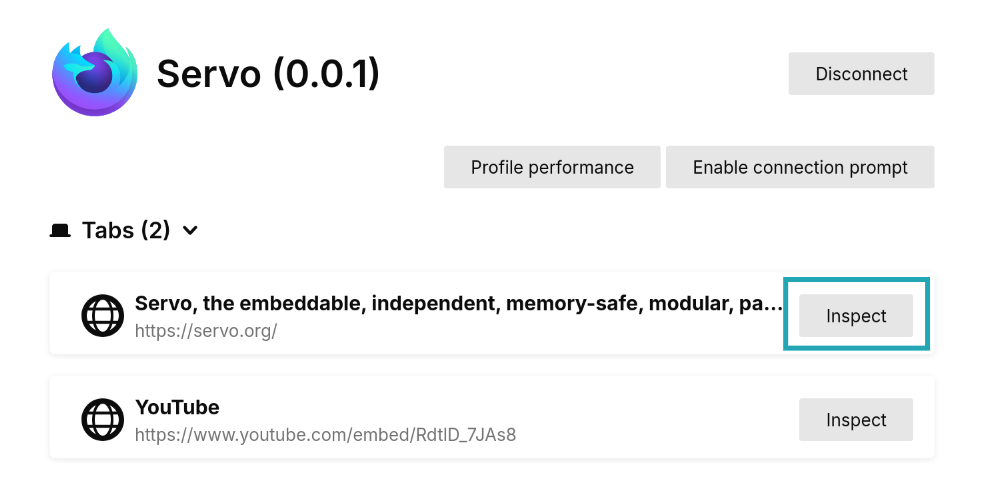
- Back in Firefox, choose a webview and click Inspect. A new window should open with the page's inspector.
Using the inspector
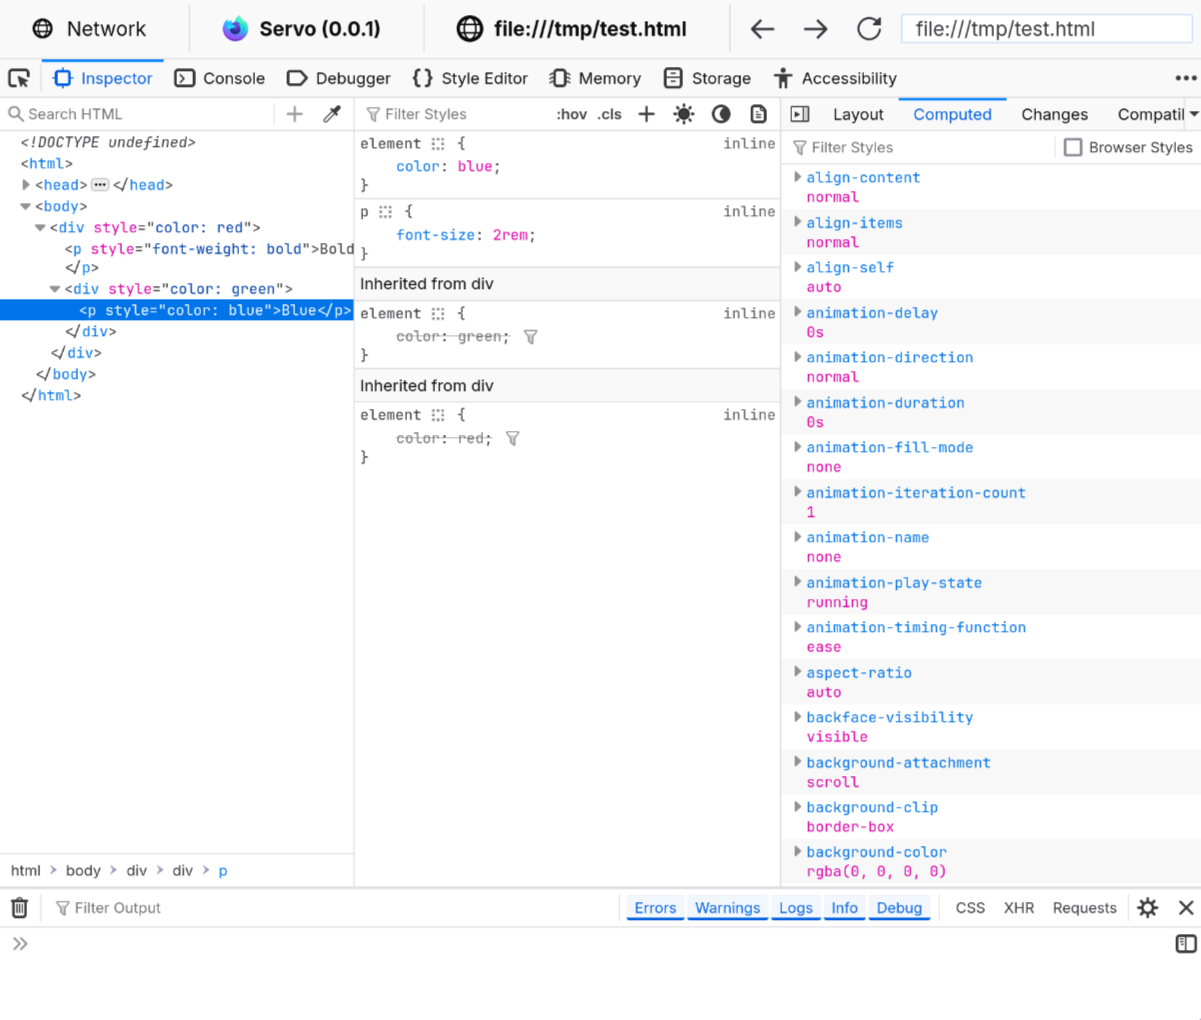
The inspector window is divided in various tabs with different workspaces. At the moment, Inspector and Console are working.
In the Inspector tab there are three columns. From left to right:
- The HTML tree shows the document nodes. This allows you to see, add, or modify attributes by double-clicking on the tag name or attribute.
- The style inspector displays the CSS styles associated with the selected element. The entries here come from the element's style attribute, from matching stylesheet rules, or inherited from other elements. Styles can be added or modified by clicking on a selector or property, or clicking in the empty space below.
- The extra column contains more helpful tools:
- Layout contains information about the box model properties of the element. Note that flex and grid do not work yet.
- Computed, which contains all the CSS computed values after resolving things like relative units.
The Console tab contains a JavaScript console that interfaces with the website being displayed in Servo. Errors, warnings, and information that the website produces will be logged here. It can also be used to run JavaScript code directly on the website, for example, changing the document content or reloading the page:
document.write("Hello, Servo!")
location.reload()
Support for DevTools features is still a work in progress, and it can break in future versions of Firefox if there are changes to the messaging protocol.